

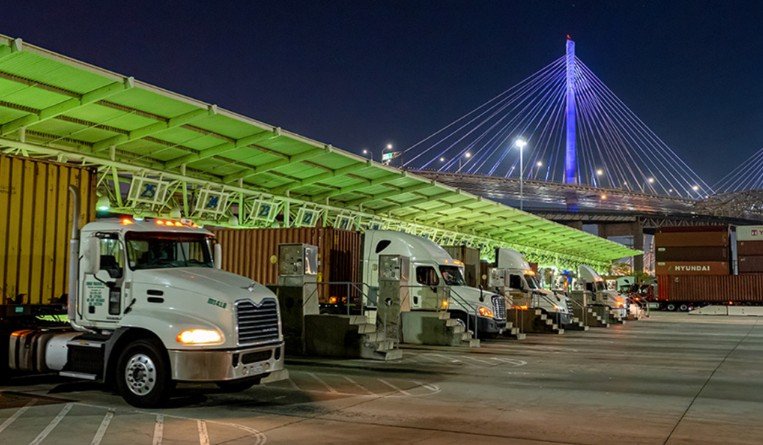
The Total Terminals International container terminal on Pier T in the Port of Long Beach is making it easier for trucks to access the facility during the overnight hours in a new pilot programme to widen access and speed deliveries amid the ongoing cargo surge. The pilot programme at the Port’s largest terminal focuses on the effort to reduce dwell time.
During the spring and early summer, the port authorities of Los Angeles and Long Beach had one major goal: whittle down to zero the number of ships riding at anchor in San Pedro Bay waiting for a slot to offload their cargo before the start of the peak season. The idea was to face the peak surge with all facilities more or less free of congestion.
The mission failed. The number of ships in the bay dwindled during the spring, but since July it has climbed again. By September 25, there were 65 vessels at anchor out in the bay, close to the peak of the congestion back in February, when over 70 ships were waiting for access to the port complex’s container terminals.
The pileup of ships in late September translated into nearly 400,000 TEU of import cargo stuck off the coast of southern California, facing lengthening delays to be offloaded. At the port of Los Angeles, the average wait time in late September was 8.7 days, up from 6.2 days in mid-August.
Coupled with landside congestion, the logjam stretched container wait times beyond two weeks. The average container dwell time at the port of LA reached almost 16 days.
The disruption has been massive. By late August schedule reliability had declined for four consecutive months. The on-time arrival rate from Asia to the US West Coast sank to a paltry 9.9% in August, down from 15.7% in July. In August 2020 it had stood at 48.6%.
Transit times for trans-Pacific shipments have fallen through the floor. According to the online rate portal Freightos, door-to-door transit times from China to the US have stretched to 71 days, compared to 40 days two years ago.
The West Coast has been inundated with imports. Overall U.S. inbound shipments in August were up 3.1% from a year earlier and 23.2% higher than two years earlier. Containerized imports rose 11.2% year-on-year and were 18.2% higher than in August 2019.
At 3,016,706 TEU, August brought the second-highest number of containers pouring into the U.S. this year, less than 12,000 below the tally for March.
The port complex of Los Angeles and Long Beach has borne the brunt of this onslaught. It accounts for nearly 40% of U.S. containerized imports and 30% of containerized exports. On average, Los Angeles and Long Beach have handled 862,000 import containers a month this year.
Up the coast, the Northwest Seaport Alliance, comprising of the ports of Seattle and Tacoma, reported a 10.4% year-on-year increase in TEU throughput for August. Containerized imports for the first eight months of the year were up 17.1%, driven by a 26% surge in imports.
Global trade intelligence firm Panjiva has described the volumes pouring into the U.S. through the West Coast as a “year-long peak season”.
Los Angeles and Long Beach have been trying to alleviate the congestion. Their latest move, announced in mid-September, was to extend gate hours. Los Angeles has expanded gate hours on weekends, while Long Beach is keeping gates open between 2 and 7 am. Mario Cordero, executive director of the port of Long Beach, has recently talked of the possibility of operating 24/7 to cope with expected demand. He does not anticipate a drop in throughput but thinks that imports will remain at elevated levels in the coming years.
The congestion at the ports is not all due to record numbers of vessels and containers hitting their docks. Another major factor has been congestion at inland rail terminals that has caused back-ups of traffic all the way to the coast. In September container dwell times at major rail hubs averaged 9.8 days. In May this had stood at 6.7 days.
With the peak season under way, nobody expects the pressure to ease any time soon. Container line Hapag-Lloyd advised its customers that the delays at Los Angeles and Long Beach are expected to continue for the remainder of this year. Others have predicted peak volumes to last well into 2022, at least until the Lunar New Year holidays.
Ian Putzger
